under construction 10-05
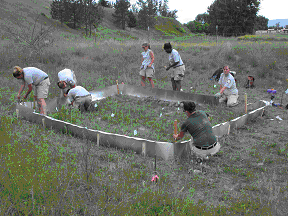
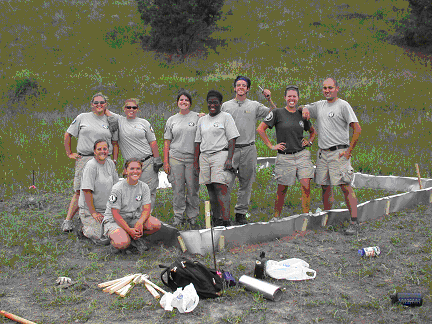
AmeriCorps installing 4 Insectory Plots at Target Range School:


Target Range School Knapweed
Biocontrol
Study
Name________________________ Date________________________
Teacher Burreson Clouse
Assisted by
(initials)____________
![]() Soil
Temperature ______ºF
Soil Sample
Plot ID____________
Soil
Temperature ______ºF
Soil Sample
Plot ID____________
|
Knapweed
Plant Count |
|||
|
|
Seedling (1-5 leaves) |
Juvenile (>6 leaves,
no flowerhead) |
Adult (flowerhead or
stalk) |
|
Number of plants |
|
|
|
|
Knapweed
Basal Collar Measurement (adult plants only) |
|||
|
|
Plant 1 |
Plant 2 |
Plant 3 |
|
Diameter (mm) |
|
|
|
Percent
Cover by
Plant Type
|
|
0% |
1-5% |
6-20% |
21-50% |
51-75% |
76-100% |
|
Knapweed |
|
|
|
|
|
|
|
Grasses |
|
|
|
|
|
|
|
Forbs |
|
|
|
|
|
|
Other
Observations:
Questions
about
activity:
Suggestions
for
future investigations:
Notes
for Data
Collection Supervisors:
Within
our study
area there are 4 sampling grids: 2 insectory grids and 2 control grids. Each grid is 4
meters x 3 meters in size, and there are a total of 48 total plots to
be
sampled. This sampling design
will provide experimental replication and allow for more rigorous
statistical
analysis. Although the study area is
small, there are two distinct vegetation zones within it: one that is
virtually
a knapweed monoculture (see IN and CN sampling grids) and one that is
composed
of knapweed and other native and non-native grasses and forbs (see IS
and CS
sampling grids). This sampling design
will allow us to explore several types of questions concerning
biocontrol of
invasive plants. Consider the
following:
- Effects of
biocontrol on knapweed (control grids vs. insectory grids)
- Influence of
plant community diversity on biocontrol (southern vs. northern grids)
- Can elementary
students be used to collect accurate data (within-grid data analysis)

Instructions:
As
student
approaches:
- Direct student to a sampling
grid (IS, CS, CN, IN) and plot (IS2, CN4, etc.).
- Place PVC sampling frame around
plot, using flags as guides
- Record Plot ID on data
sheet(C**for control plots; I** for insectory plots) and pull the ID
pinflag from the center of the plot
- Record student’s name, teacher,
and your initials
- Have student insert soil
thermometer into the approximate center of the plot at about 3” depth –
after the student has collected all other data, record soil temperature
on the data sheet.
Soil
Sampling:
We
will be
collecting soil samples from each plot to determine soil moisture, pH,
and
fungal community associations. For each
student and plot:
- Collect a soil core from each
quadrant in the plot (from bare ground where possible)
- Seal all four cores into a
single Ziplock bag
- Write the Plot ID (IN2, CS4, etc), date, and your
initials on the bag
Knapweed
Plant
Count:
- Show student reference samples
for knapweed seedling, young, and adult plants
- Seedling = 1-5 leaves
- Juvenile = 6 leaves to
initiation of flower head
- Adult = Initiation of flower
head to maturity
(from Jacobs and Sheley, J.
Range Manage. 51(6), 1998)
- Supervise plant count (you can
help students keep track of counts by suggesting that they count plants
from top to bottom or left to right in plots, and by using the ¼
plot templates to focus on specific areas)
- Record counts in appropriate
table
Knapweed
Basal
Collar Measurement:
- Show student where to measure
the basal collar
- Instruct student to randomly
choose three ADULT plants to measure
- Record measurements in
appropriate table
Percent
Cover
of Plants in Plot:
Students
will be
collecting % cover of knapweed, grasses, and forbs in each plot. Here are some guidelines for calculating
percent cover for each plant type:
- A plant covering a 10cm x 10cm
area occupies approximately 1% of the total area in the plot, a 30cm2
plant occupies 10% of the plot, and a 50cm2 plant occupies
25% of the plot.
- Use the reference squares to
calculate total % cover of each plant type (10cm2 = 1%, 30cm2
= 10%, and 50cm2 = 25%)
***Note:
Total percentage across vegetation types should not add up to 100%,
unless
there is no bare ground showing in the sampling plot!!!
As
student leaves:
Direct
her/him to
select a prize from the box!